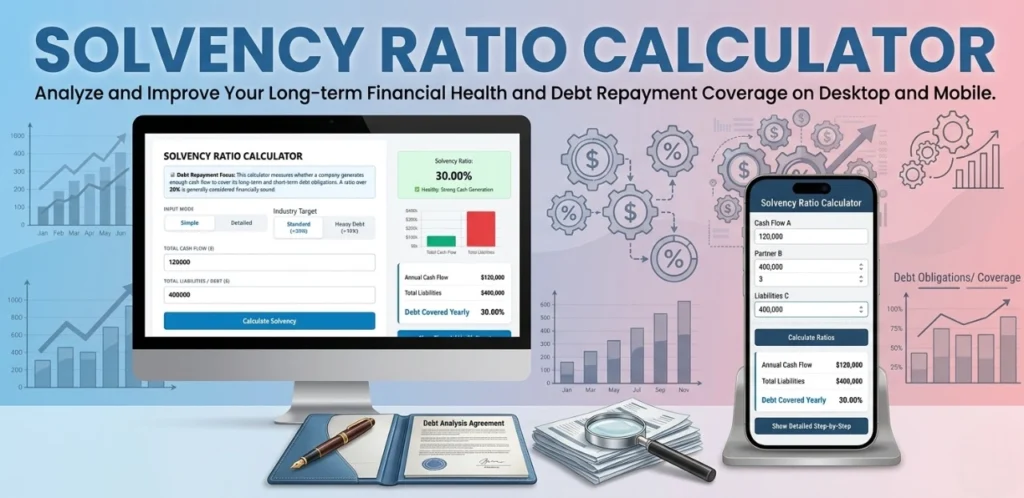
Solvency Ratio Calculator
30.00% ✅ Healthy: Strong Cash Generation
Debt & Solvency Analysis
A breakdown of the company's ability to service its debt based on your inputs.
| Metric | Value | Interpretation |
|---|
What is a Solvency Ratio? A Complete Guide to Debt Management
When evaluating a company as an investment or lending opportunity, one of the biggest red flags to watch for is excessive debt. But looking at the total debt number in isolation doesn't tell the whole story. A company with $10 million in debt is in huge trouble if they only make $50,000 a year, but perfectly fine if they generate $5 million in cash flow annually.
This is exactly why analysts use the Solvency Ratio.
Unlike liquidity ratios (which only look at the short-term ability to pay bills over the next 12 months), solvency ratios look at the "big picture" to determine long-term survival.
The Solvency Ratio Formula
There are several variations of solvency metrics (such as the Debt-to-Equity ratio, which you can analyze using our Proprietary Ratio Calculator), but the most comprehensive standard formula calculates Cash Flow to Total Debt:
Let's break down the components:
- Net Income: The company's bottom-line profit after taxes and expenses have been paid.
- Non-Cash Expenses: This is primarily Depreciation and Amortization. Because these are accounting deductions that don't actually cost the company physical cash in the current year, they are added back to Net Income to reveal the true cash the company generated.
- Total Liabilities: The sum of all short-term debt (due within a year) and long-term debt (mortgages, bonds, etc.).
Step-by-Step Calculation Example
Let’s assume a manufacturing company has the following financial data for the year:
- Net After-Tax Income: $150,000
- Depreciation: $50,000
- Short-Term Debt: $100,000
- Long-Term Debt: $700,000
Step 1: Calculate Total Cash Flow
$150,000 (Income) + $50,000 (Depreciation) = $200,000 in Cash Flow
Step 2: Calculate Total Liabilities
$100,000 (Short-Term) + $700,000 (Long-Term) = $800,000 in Total Debt
Step 3: Apply the Formula
$200,000 ÷ $800,000 = 0.25 (or 25%)
This means the company generates enough cash flow in a single year to pay off 25% of its entire debt load. This is a very strong position.
How to Interpret the Solvency Ratio
As a general rule of thumb in finance, a solvency ratio greater than 20% is considered healthy. Here is how analysts typically view the results:
- Above 20%: The company is highly solvent. It generates plenty of cash to easily service its debt, invest in new equipment, and withstand economic downturns. Creditors are highly likely to approve loans.
- 10% to 20%: This is a moderate zone. The company is stable, but a bad economic year could make debt repayments stressful. (Note: Highly capital-intensive businesses like utility companies safely operate in this range).
- Below 10%: The company is highly risky. A significant drop in sales could lead directly to default or bankruptcy because they do not have enough cash flow to support their heavy borrowing.
Frequently Asked Questions (FAQs)
What is the difference between Solvency and Liquidity?
Liquidity measures a company's ability to pay off its short-term bills (due within 12 months) using assets like cash and inventory. Solvency measures a company's ability to pay off all its long-term debts over many years. A company can be highly profitable and solvent, but still face a liquidity crisis if all its cash is tied up in slow-moving inventory.
Why do we add Depreciation back to Net Income?
Depreciation is an accounting entry that lowers taxable income by spreading out the cost of a large asset over time. However, the company didn't actually write a check for "depreciation" this year. Adding it back gives a much more accurate picture of the actual physical cash the business generated to pay down debt.
Is it possible to have a Solvency Ratio over 100%?
Yes, absolutely! If a company has very little debt and high cash flow, its ratio will exceed 100%. For example, if cash flow is $500,000 and total debt is only $100,000, the solvency ratio is 500%. This indicates an exceptionally safe business.
How to Use the Solvency Ratio Calculator
- Choose Input Mode
Select Simple for a quick calculation or Detailed for more advanced financial analysis. - Select Industry Target
Choose Standard (>20%) for normal businesses or Heavy Debt (>10%) for industries that operate with higher borrowing. - Enter Total Cash Flow
Input the company’s annual total cash flow generated from operations. - Enter Total Liabilities / Debt
Provide the company’s total liabilities or outstanding debt. - Click “Calculate Solvency”
Press the Calculate Solvency button to compute the solvency ratio instantly. - Analyze the Result
The tool will display the solvency ratio percentage and indicate the company’s financial health.
Solvency Ratio Reference Table
| Solvency Ratio | Financial Strength | Risk Level | Interpretation | Recommended Action |
|---|---|---|---|---|
| Above 40% | Excellent | Very Low | The company has strong cash flow and very low dependency on external debt. | Continue current financial strategy and maintain strong cash flow management. |
| 30% – 40% | Very Strong | Low | The company is financially stable and can comfortably meet its debt obligations. | Maintain stable operations and monitor liabilities regularly. |
| 20% – 30% | Healthy | Moderate-Low | The company has adequate cash flow to manage liabilities but should monitor debt levels. | Improve operational efficiency and control borrowing. |
| 15% – 20% | Moderate | Medium | The business has moderate financial strength but relies partially on external debt. | Focus on increasing revenue and reducing liabilities gradually. |
| 10% – 15% | Weak | High | Cash flow may not be sufficient to cover all obligations in stressful situations. | Reduce debt, improve cash flow, and strengthen financial planning. |
| Below 10% | Very Weak | Very High | The company is highly dependent on external borrowing and may face financial instability. | Urgent financial restructuring and debt management may be required. |
Industry Considerations
- Capital-intensive industries (manufacturing, infrastructure) may operate safely with ratios around 10–20%.
- Service-based businesses generally aim for ratios above 20–30% for better financial stability.
Key Insight
A higher solvency ratio usually indicates stronger financial health because the company generates enough cash flow to cover its liabilities and long-term obligations.
Site Links for Solvency Ratio
- Investopedia
https://www.investopedia.com/terms/s/solvencyratio.asp
One of the most trusted financial education websites explaining solvency ratios, formulas, and examples. - Wall Street Prep
https://www.wallstreetprep.com/knowledge/solvency-ratio/
Covers solvency ratio concepts used in financial modeling and investment analysis. - Harvard Business School Online
https://online.hbs.edu/blog/post/financial-ratios
Provides insight into financial ratios used to measure company performance and solvency. - U.S. Securities and Exchange Commission
https://www.sec.gov/education
Official government financial education resources explaining financial health metrics. - International Monetary Fund
https://www.imf.org/en/Data
Provides economic indicators and financial stability analysis used globally. - Wikipedia
https://en.wikipedia.org/wiki/Solvency
General overview of solvency and financial stability concepts.